When planning a rally, march, or other protest, it is helpful for everyone on the organizing team to be able to visualize the area and how people will flow through it over the course of the action: Where will the signs be raised? Where will the speakers be standing? How will the crowd move as they form up to march?
One of the easiest answers is to screenshot a mapping app and then draw circles and arrows on top to illustrate the plan — and I do a lot of this — but we can take this a step further by using those same apps’ overhead photography models to generate a bird’s eye view.
What Is A Bird’s Eye View?
A so-called bird’s eye view is an image showing an overhead perspective, as if we were a bird (or drone) flying nearby and looking down at a scene at an angle. These were popularized in the 1800s, and combine aspects of a top-down map and an on-the-ground visual perspective.
While I still love traditional maps, I think that this kind of bird’s eye view can make it easier for organizers and volunteers to visualize an area as a three-dimensional real place with less than effort than if they were looking at a map.
Finding Viewpoint Images
Google Maps is my go-to source for bird’s eye views, but Apple Maps, Bing Maps, and other tools all have similar capabilities, and for any specific location you might find that one or the other has more-attractive imagery, or has been updated more recently to include the latest changes in the area.
Adding Lines, Shapes, and Labels
I use a desktop illustration application to apply the markup, but an online tool such as Canva would also do the job — you can use any app you’re familiar with, as long as it lets you work in layers and treat the overlaid lines and shapes as objects that you can move around over time, which allows you to draft an image, share it with the team, then revise it as people provide feedback or the plan changes over time.
You might also find it’s helpful to make copies of a view and then adjust them for different audiences — for example, you might have one version that focuses on where banners and signs should be arranged for use by the art & visuals team, and another version that focuses on street traffic and crowd flow for use by the marshal team. These could use separate underlying images, but often it’s sufficient to use the same perspective and just have different labels and arrows overlaid onto them.
Examples
Below are examples from three different actions I’ve helped to plan over the last year.
Example: Foley Square
For a recent protest outside Federal Plaza, I started with a Google Maps view of Foley Square, in “Satellite” mode, with overlaid labels turned off.
I zoomed in, tilted the camera over at a 45° angle, and fiddled with the viewpoint for a while to ensure that the perspective included all of the parts of the scene we needed to consider — then I took a screenshot.
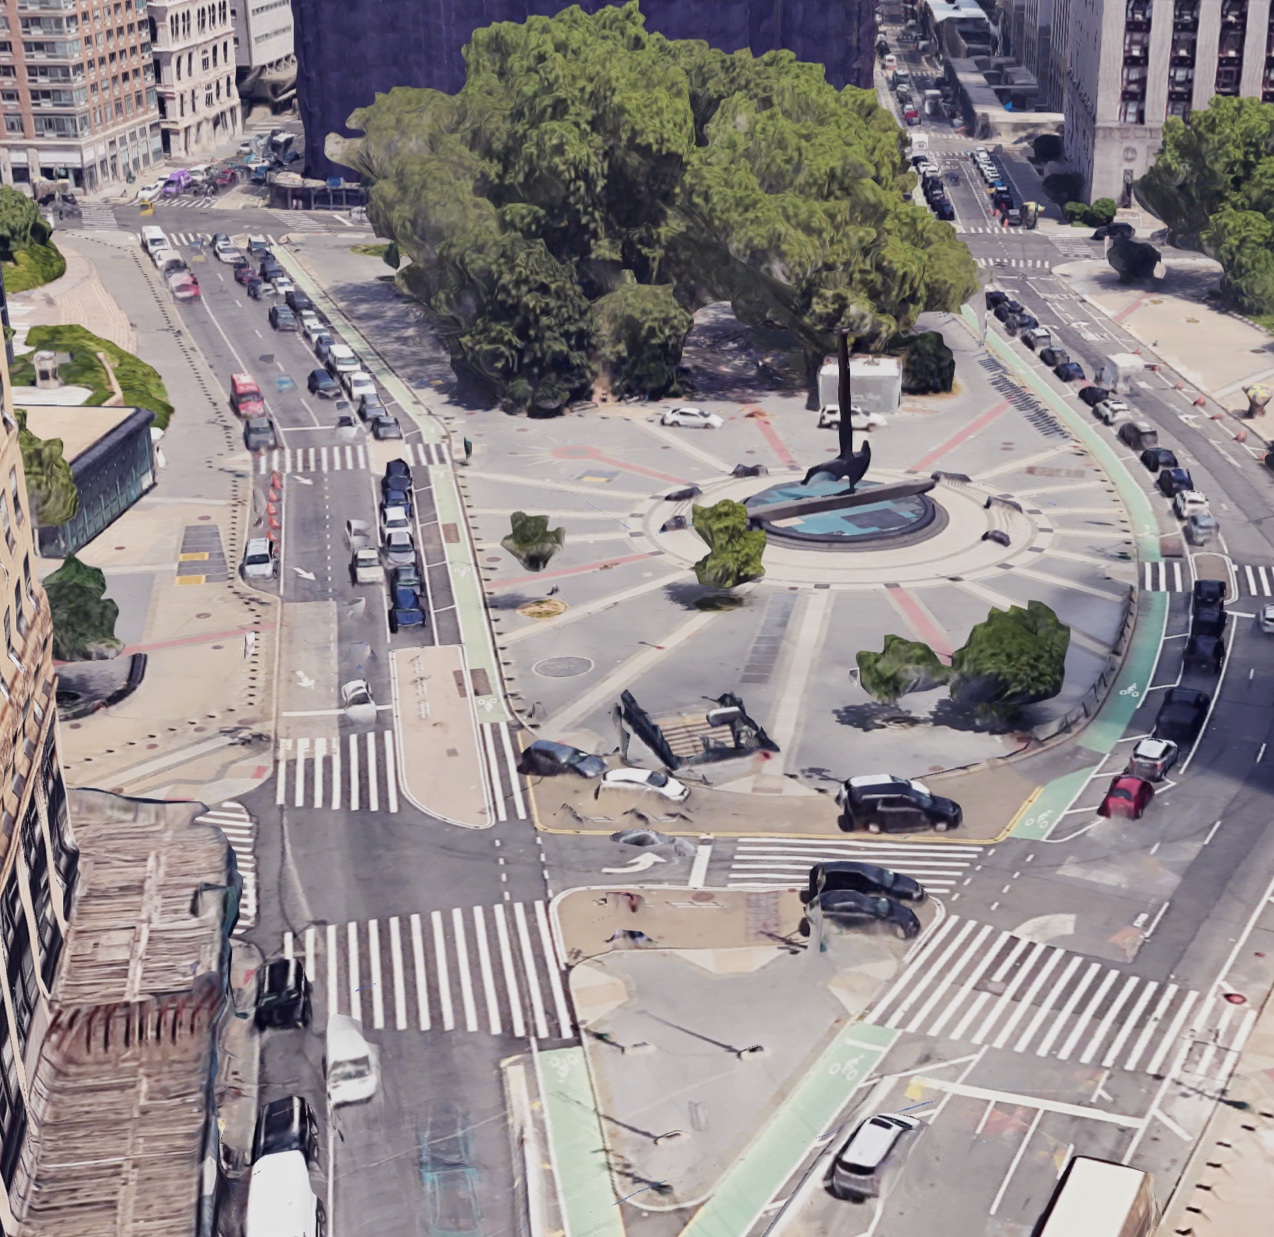
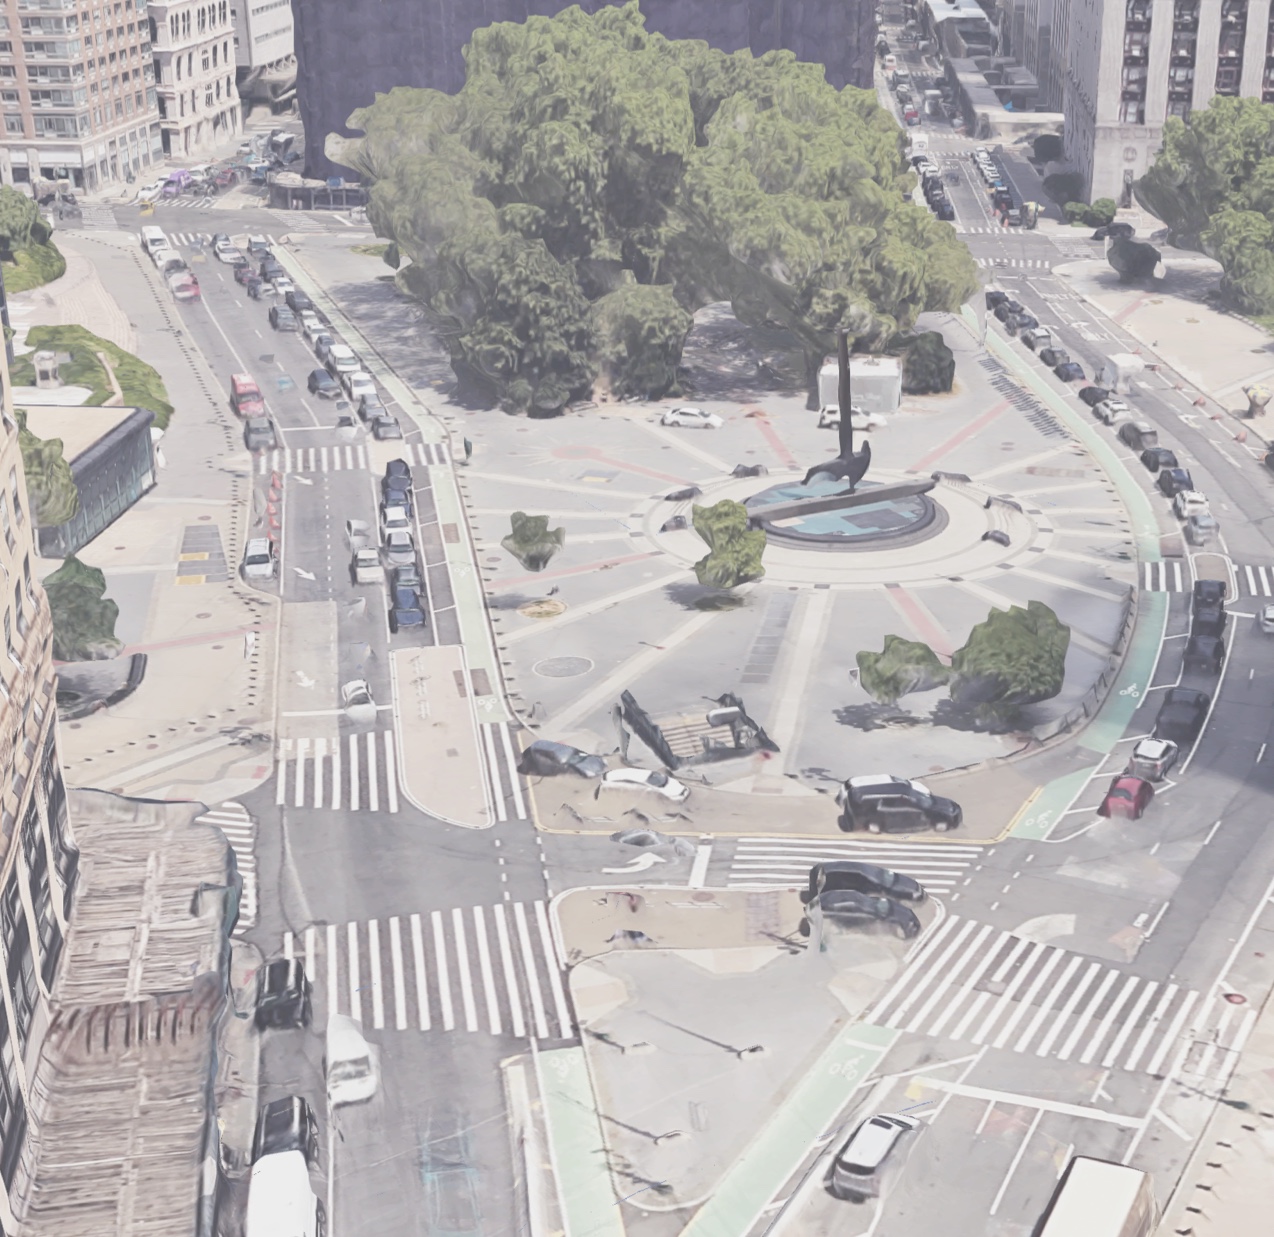
To make it easier to see the items I drew on top of that view, I used the Mac’s built-in image tools to make the image paler: brighter and with less color.
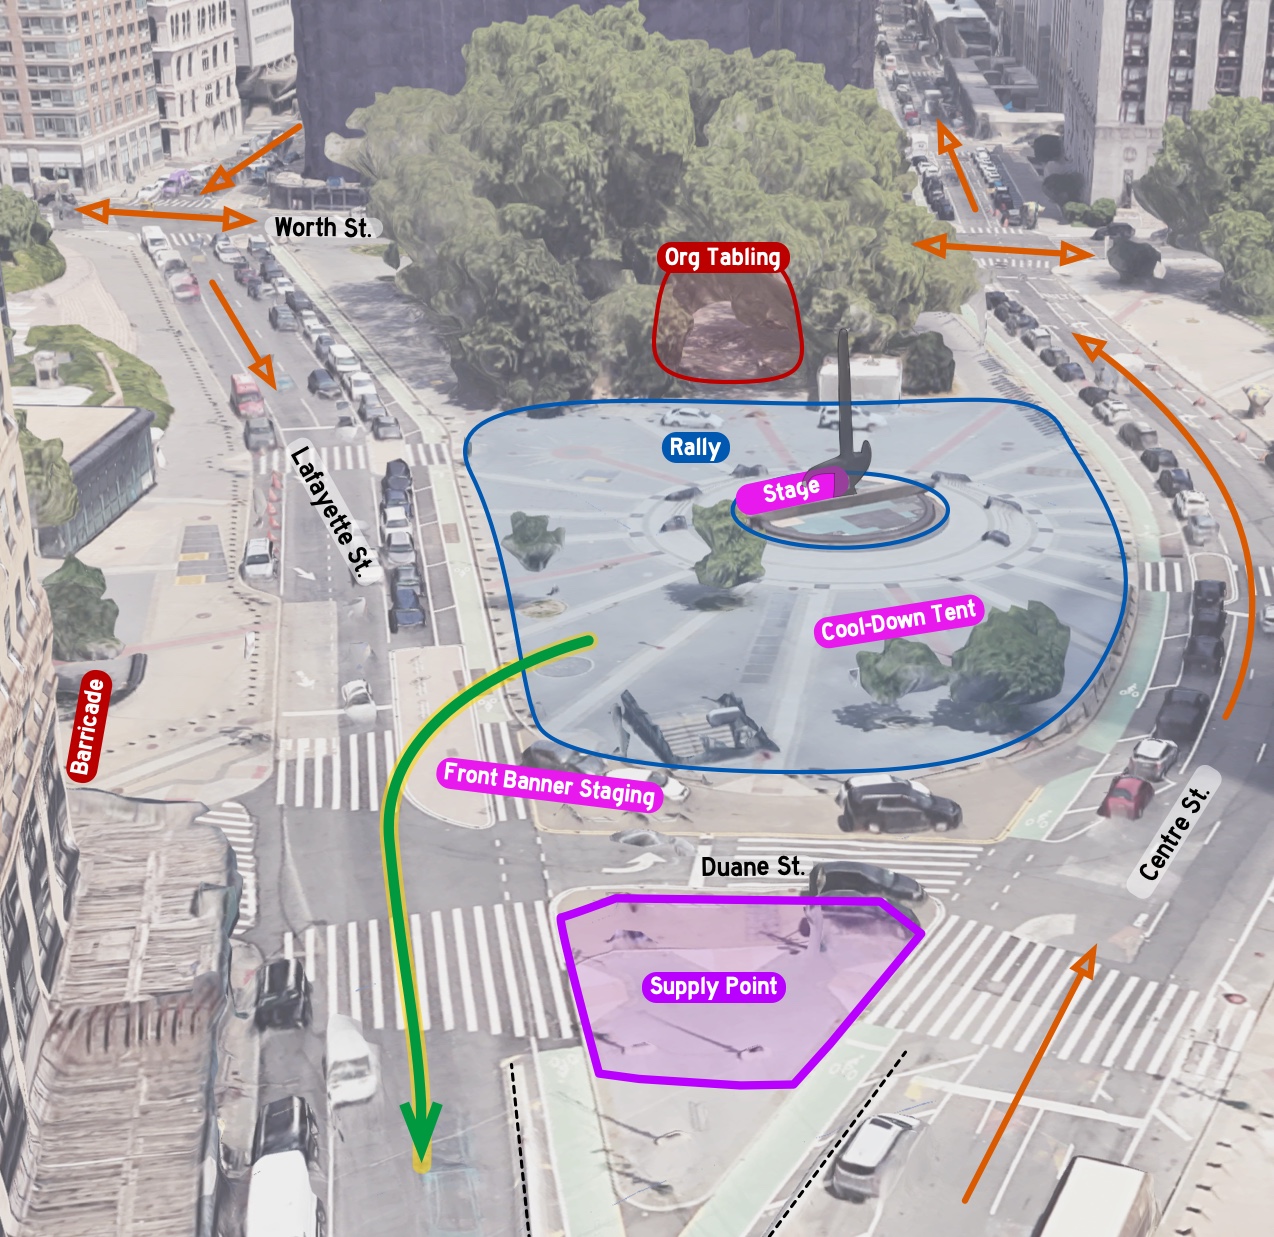
Then I used a few bright colors to highlight the areas for different activities, write in the street names and traffic directions, and note items we needed to set up or avoid.
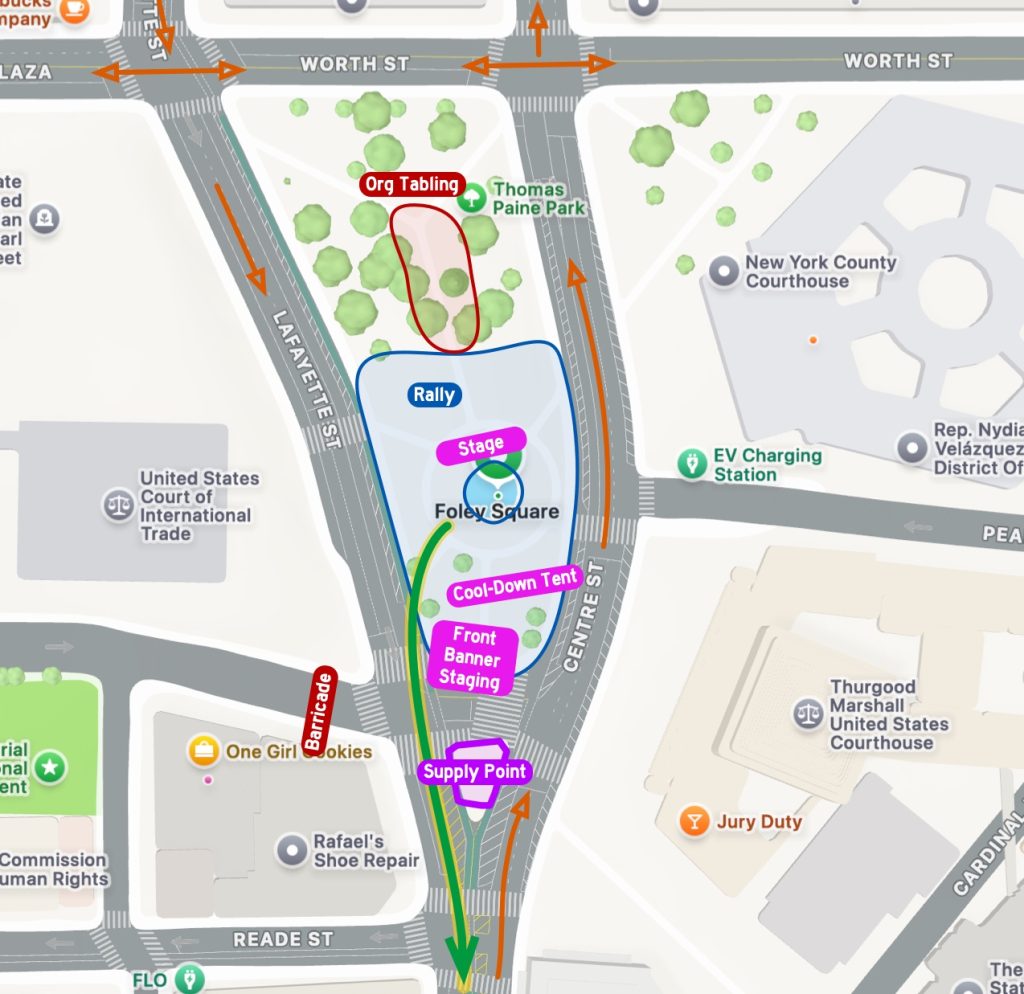
This same information could also be shown on a flat map, but I find that it’s not as evocative of the actual place:
Example: Times Square
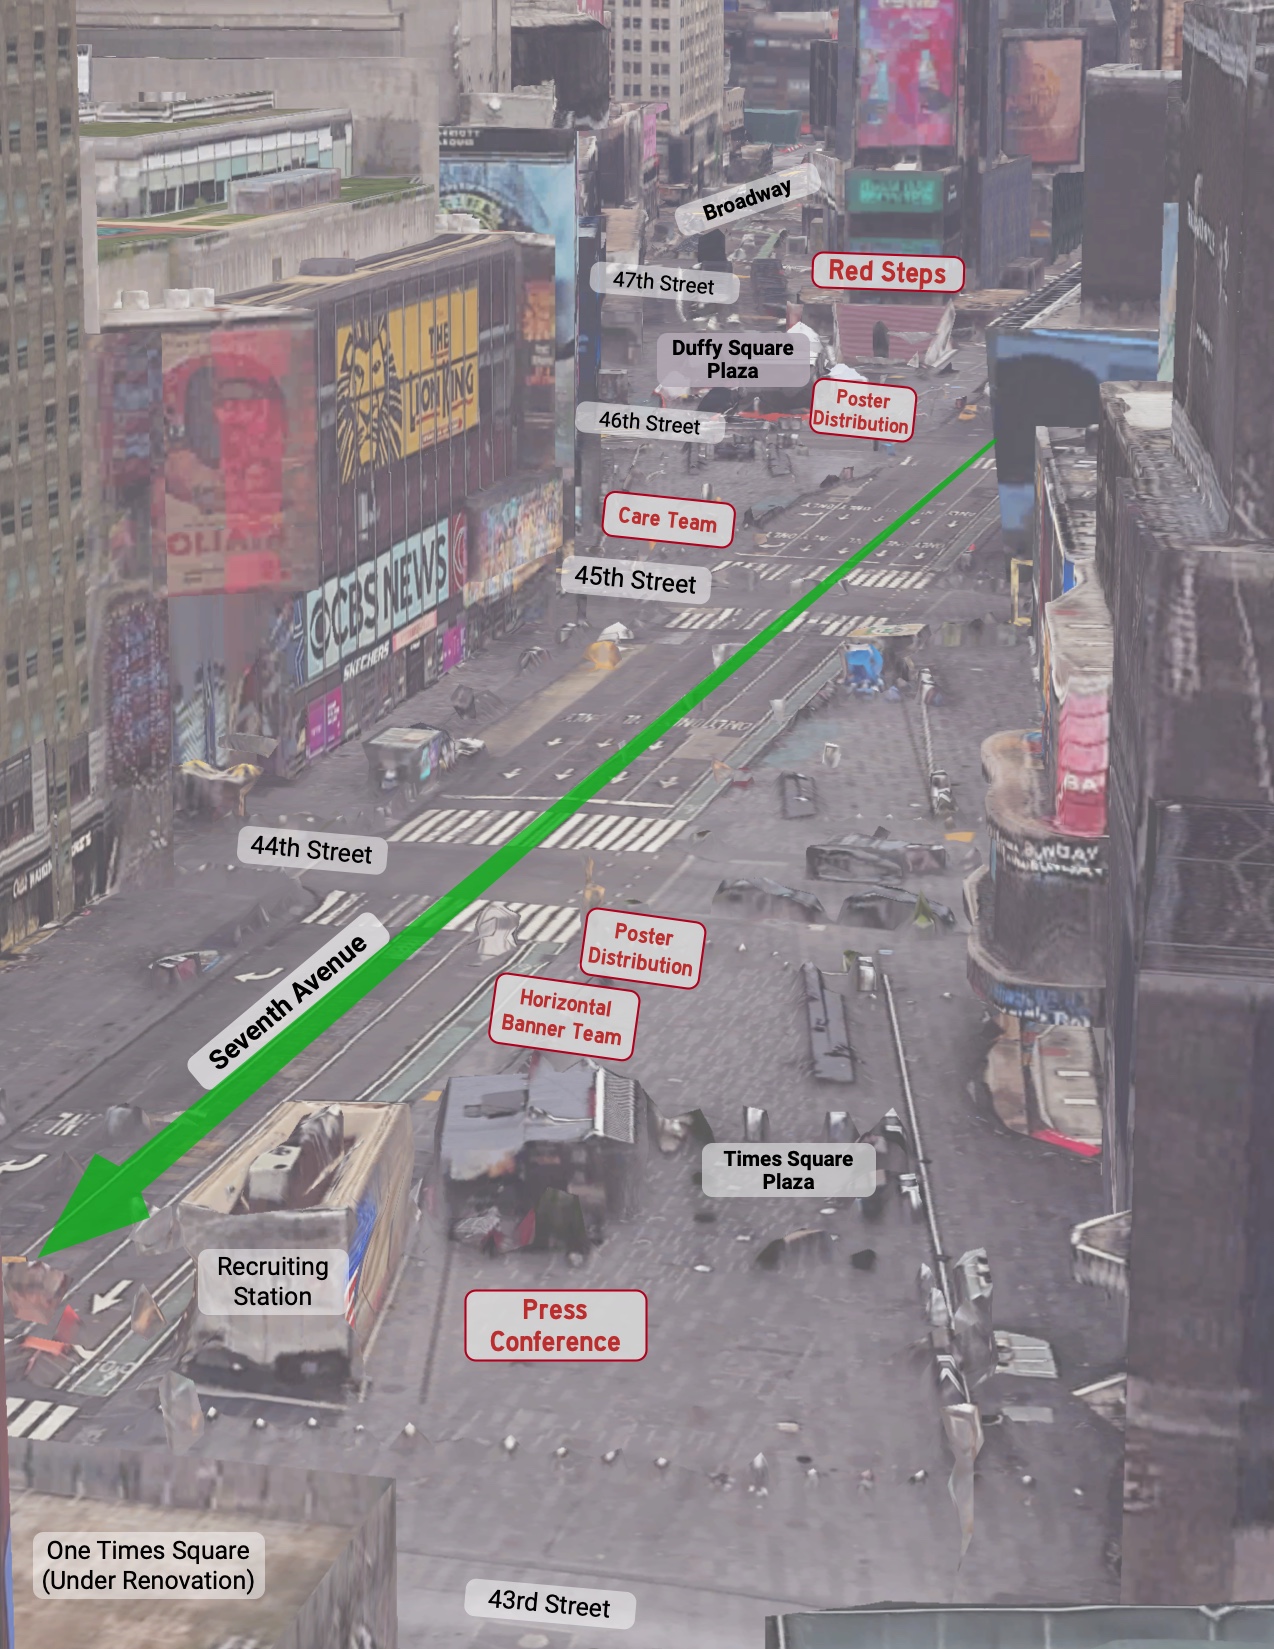
A recent event took place in Times Square, and involved a team of hundreds of organizers and volunteers, along with thousands of participants, spread over more than 200,000 square feet.
A bird’s eye view helps to show where key activities would take place, in a way that reminds people of what those places look like in real life, and helps to visualize the distances between each location.
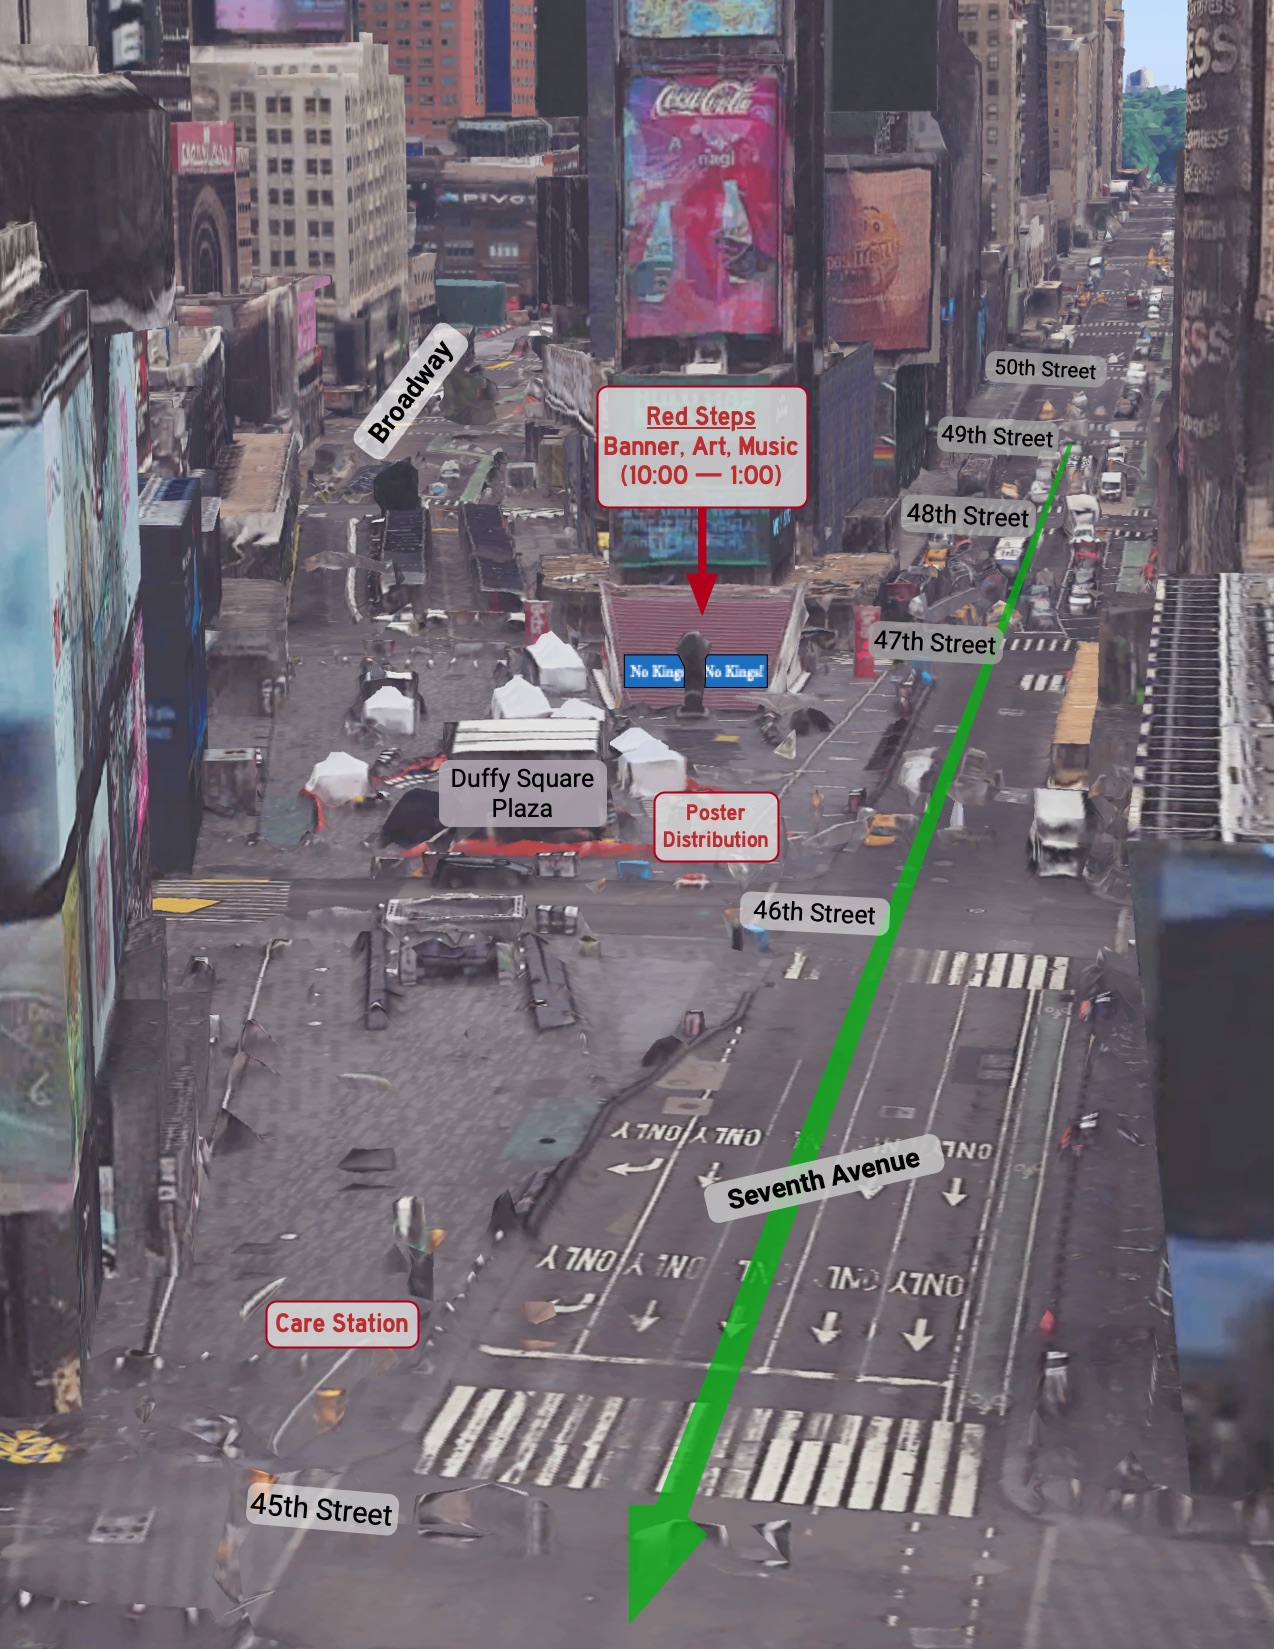
There was enough going on that it was helpful to have a separate view of the northern end of Times Square, sometimes known as Duffy Plaza.
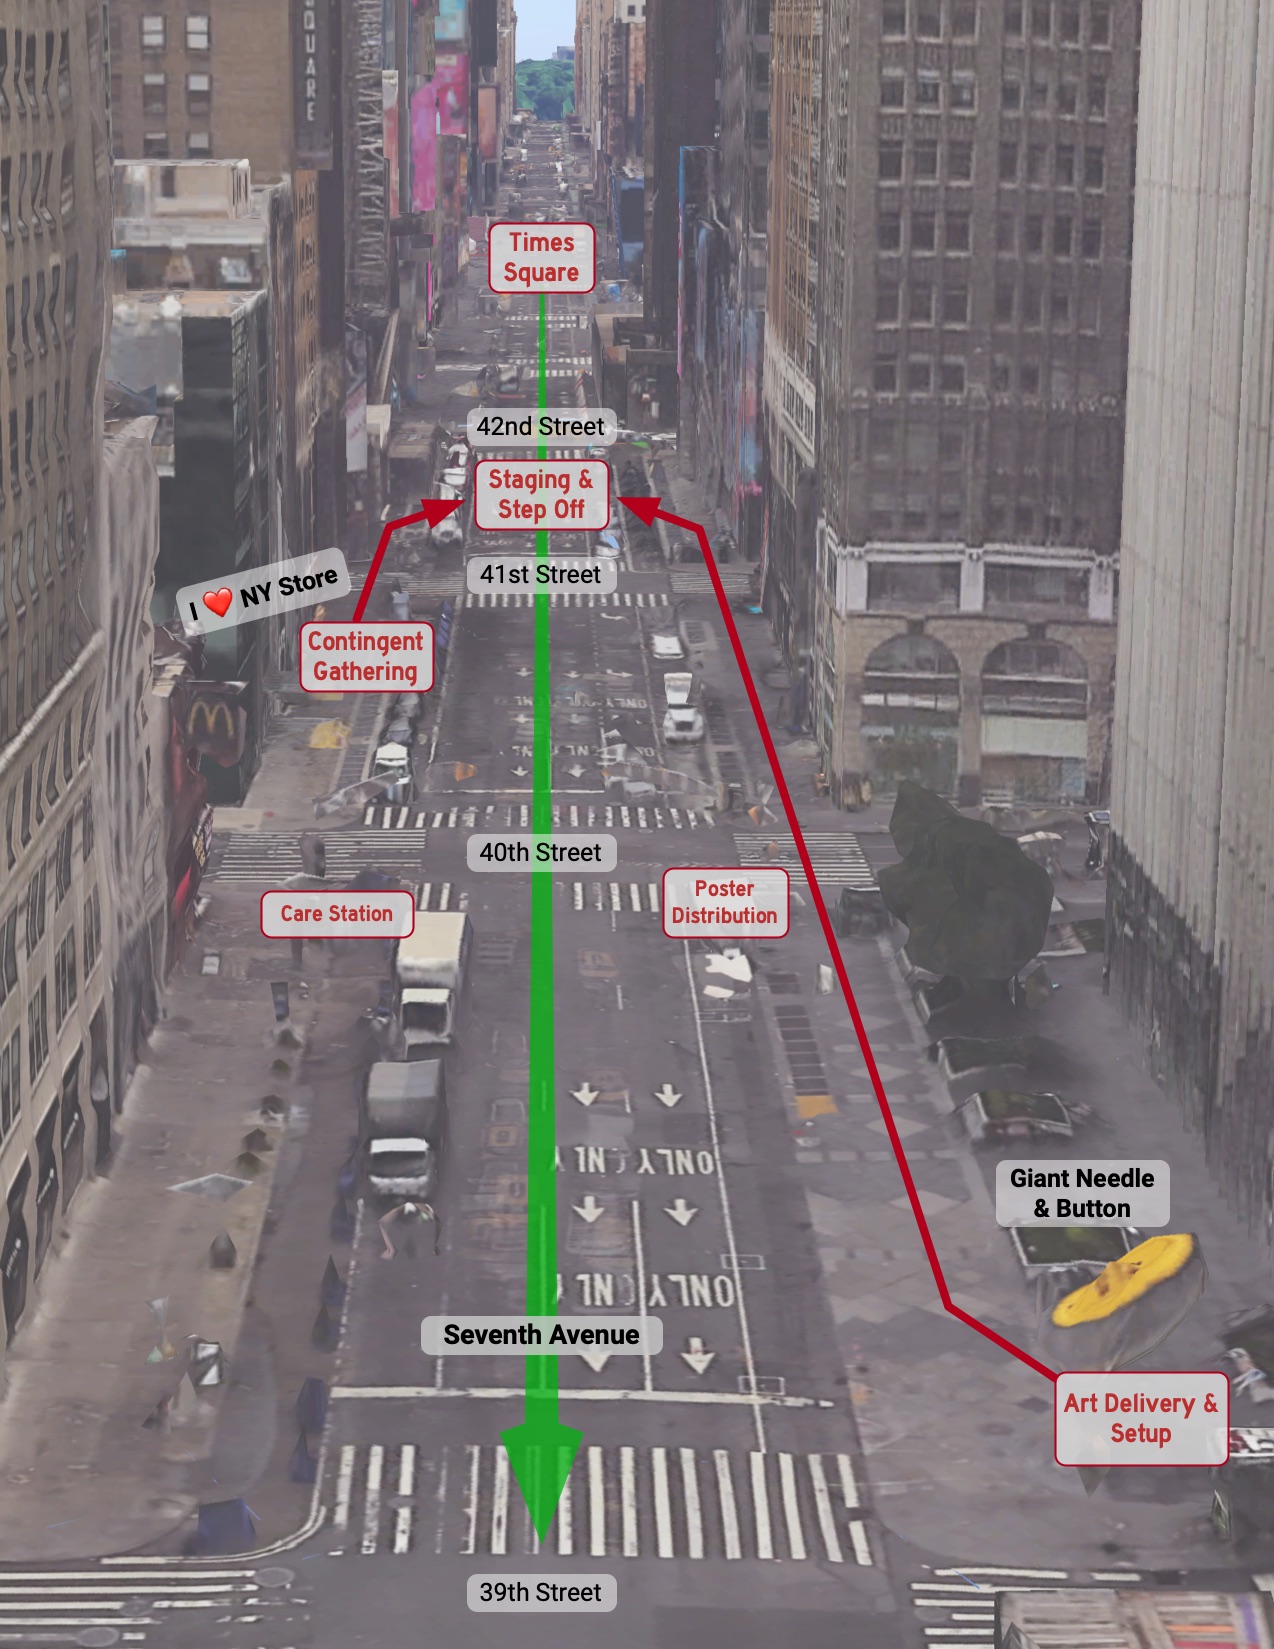
A third view highlighted the maneuvers required to stage up front banners and accompanying contingent in the hour before the march stepped off, then to get them to the front of the crowd at the right moment.
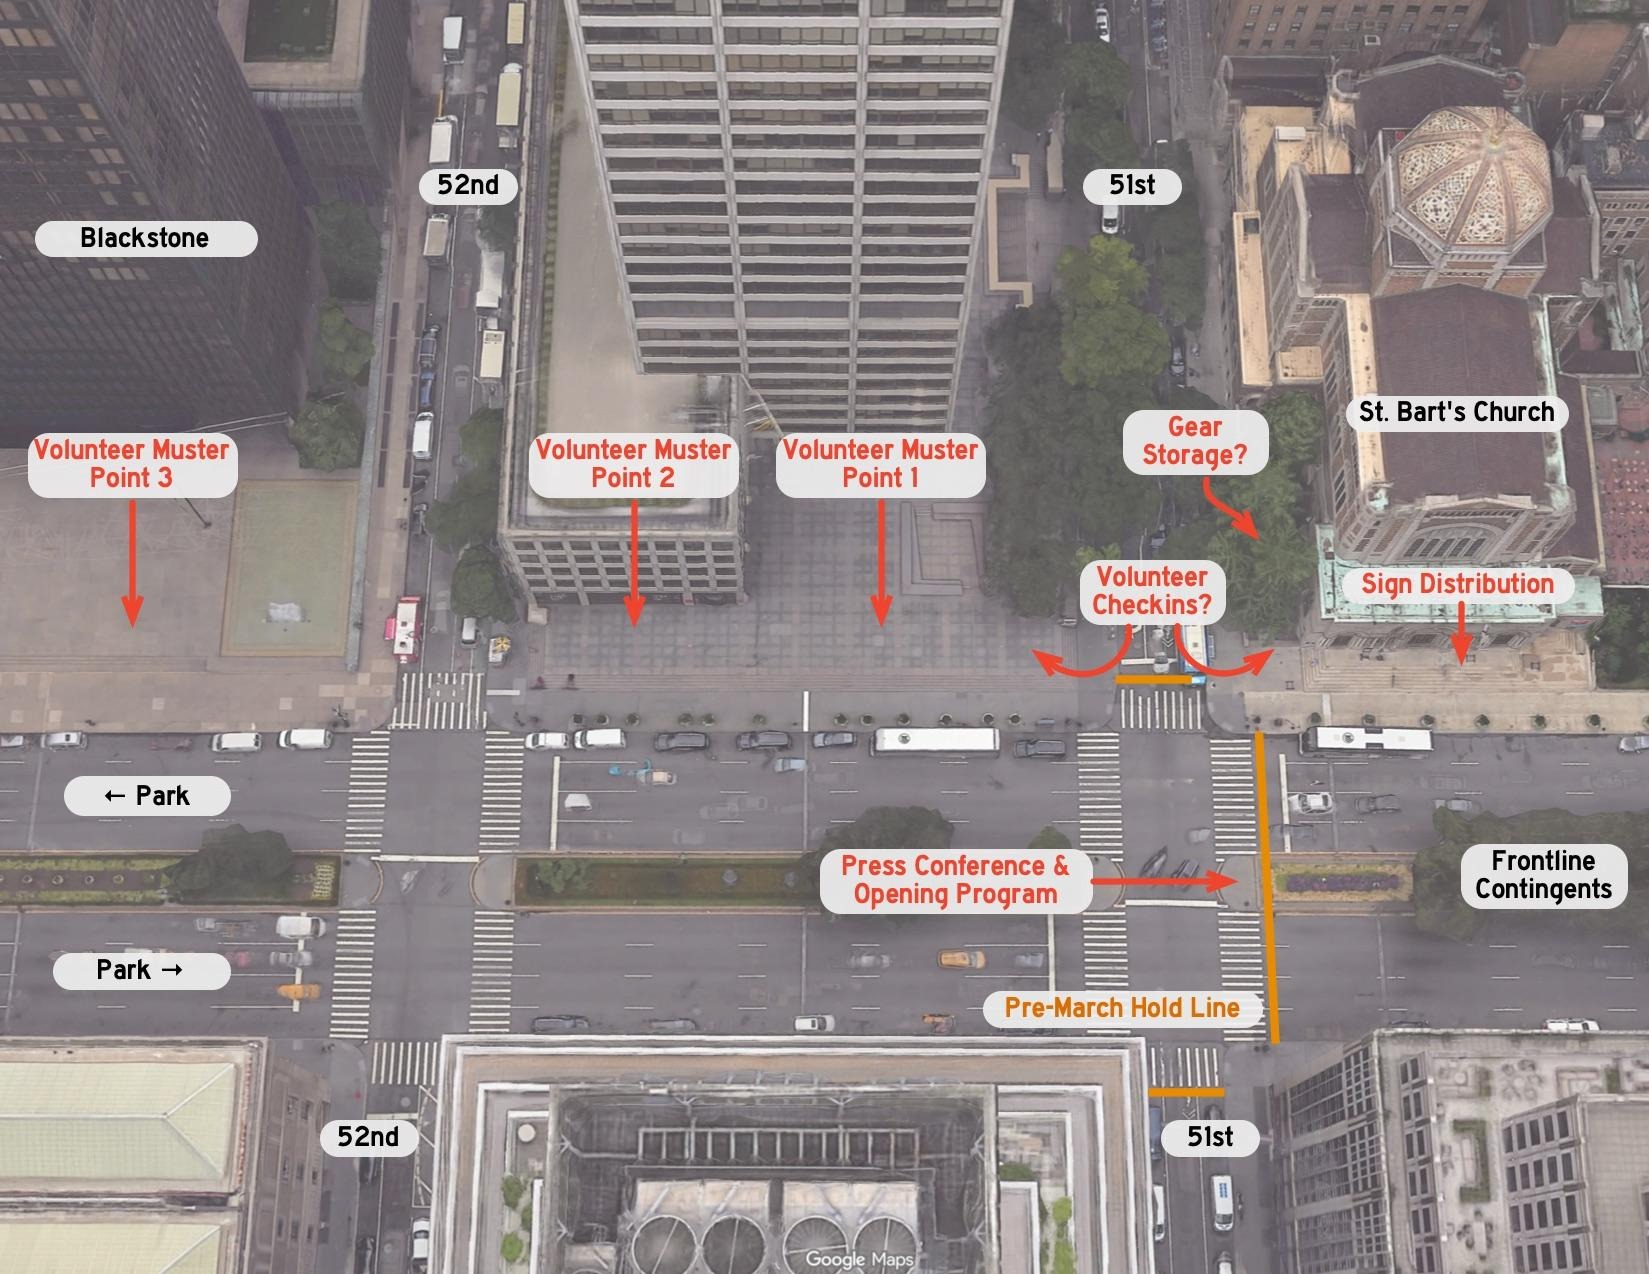
Example: Park Avenue
Sometimes a more-nearly-vertical perspective can help to show both streets and sidewalks in an area at similar levels of detail. This is akin to an overhead map, but less abstract — if you’ve been to this stretch of Park Avenue in midtown, seeing the buildings’ facades might help remind you of the experience.
Leave a Reply